The always illuminating Development Impact Blog (link) posts a synopsis of a nice paper by Jing Cai on social network effects in the take up of weather insurance in China (link). Social network effects are identified via a nice experimental design, which I’ll paraphrase as follows: financial education and insurance offers are given to a random subset of individuals in year 1. Then in year 2, insurance offers are given to the rest of the individuals. Social network effects on year 2 targets are measured in terms of their take-up rate as a function of the fraction of their friends that had been targeted in year 1. Positive social network effects correspond to a positive relation between year 2 take-up and the fraction of one’s friends having been targeted in year 1. The icing on the cake is that experiment also randomized the price of insurance offers, and could therefore translate the social network effect into a price equivalent, findings that the “effect is equivalent to decreasing the average insurance premium by 12%.”
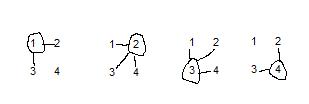
One concern that I am not sure is addressed in the paper is a potential selection bias that can arise due to differences in individuals’ network size. To see how this works, consider a toy example. A community consists of 4 people labeled 1, 2, 3, and 4. Graphs of the friendship networks between these people are as follows:
 Person 1 is friends with 2 and 3, person 2 is friends with 1, 3, and 4, and so forth.
Suppose that in year 1, 2 out of these 4 are randomly assigned to receive an intervention. That yields 6 possible year 1 treatment groups, each equally likely: {1,2}, {1,3}, {1,4}, {2,3}, {2,4}, or {3,4}. As in the paper discussed above, suppose what we are interested in is the effect of some fraction of your friends receiving the year 1 treatment. We can compute what these fractions would be under each of the year 1 treatment assignments. With these, we can compute the propensity that a given fraction of a person’s friends received the year 1 treatment. These calculations are shown in the following table:

What this shows is that simple randomization of year 1 assignment does not result in simple random assignment of fractions for the year 2 analysis. Take person 1, for example. This person has a 2/3 chance of having half of her friends targeted in year 1, and a 1/3 chance of having all of her friends targeted. This is in contrast to person 2, who has no chance of having either half or all friends targeted. The design does not result in representative samples of people receiving the different fraction values. Examining differences conditional on fraction values does not necessarily recover causal effects because the populations being compared are not exchangeable. To justify a causal interpretation, one would have to assume that network structure is ignorable or that such ignorability could be achieved through covariates, etc. The problem arises because fraction value is a function of both a person’s friendship network and the year 1 assignment. Only one of those two elements is randomized.
Peter Aronow and I have generalized this issue in a paper on “Estimating Causal Effects Under General Interference.” A recent working draft that we presented at the NYU Development Economics seminar is here: link. The basic idea behind the methods that we propose are to (1) define a way to measure direct and indirect exposures, (2) determine how for each unit of analysis the design induces probabilities of different kinds of exposures, and (3) use principles from unequal probability sampling to estimate average causal effects of the various direct and indirect exposures. Another point that arises from the analysis is that you can use the propensities of different exposures to assess the causal leverage of different designs. For example, consider again the toy example above. Suppose that these four units constitute one cluster among many possible clusters. Conceivably, a design that randomized not only which people were targeted in the first round within a cluster but also how many were targeted from cluster to cluster could produce fraction value propensities that were equal or, short of that, at least ensured that everyone had some probability having each of a variety of fraction values.


